So, let`s go.
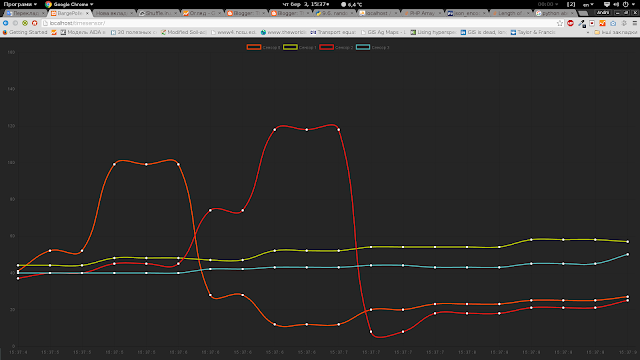
For instance we need to stream data from multiple sensors or devices directly to server and display them with minimal delay.
This solution could be used for smart-house systems, air quality devices, and other, and other.
We used this solution for streaming data from graphene sensors during hackathon.
Described system includes:
- Arduino board which send data via serial port,
- Python script, which catch data from serial and send it to web API,
- PHP API which receive data via POST and hold last record into mysql database;
- JS+html frontend, which get and display latest updated data from database via PHP API.
Arduino sketch
As can you see, the sketch is extremely simple. It just get data from analogue pins and send it to serial as delimited string.----------------------
int sensor1 = 0;
int sensor2 = 1;
int sensor3 = 2;
int sensor4 = 3;
int val1,val2,val3,val4 = 0;
void setup()
{
Serial.begin(9600);
}
void loop()
{
val1 = analogRead(sensor1);
val2 = analogRead(sensor2);
val3 = analogRead(sensor3);
val4 = analogRead(sensor4);
Serial.print(val1);
Serial.print(";");
Serial.print(val2);
Serial.print(";");
Serial.print(val3);
Serial.print(";");
Serial.print(val4);
Serial.print("\n");
delay(1000);
}
----------------------
Python script for data transmitting
After we have sent data via serial, we need to transmit them to the server----------------------
import urllib
import urllib2
import serial
import time
ser = serial.Serial('/dev/ttyUSB3', 9600, timeout=5)
time.sleep(5) # wait for Arduino
while True:
bytesToRead = ser.inWaiting()
linen = ser.readline()
value = linen.split(";")
print int(value[0])
print int(value[1])
print int(value[2])
print int(value[3])
url = 'http://path_to_your_website.com/signal.php'
values = {'sensor1' : int(value[0]),'sensor2' : int(value[1]),'sensor3' : int(value[2]),'sensor4' : int(value[3]),}
data = urllib.urlencode(values)
req = urllib2.Request(url, data)
response = urllib2.urlopen(req)
print response.read(),"+"
----------------------
PHP API
API includes 2 parts and 1 config file. db_conf.php - here we hold database connection settings---------------------- //Database Information $db_host = "localhost"; //Host address (most likely localhost) $db_name = "spatial"; //Name of Database $db_user = "root"; //Name of database user $db_pass = ""; //Password for database user mysql_connect($db_host, $db_user, $db_pass);//database connection mysql_set_charset( 'utf8' ); mysql_select_db($db_name) or die(mysql_error()); ----------------------signal.php - this file we use to get POST data and update database with fresh values
----------------------

require_once('db_conf.php');

$lastval1 = mysql_real_escape_string($_POST['sensor1']);
$lastval2 = mysql_real_escape_string($_POST['sensor2']);
$lastval3 = mysql_real_escape_string($_POST['sensor3']);
$lastval4 = mysql_real_escape_string($_POST['sensor4']);

$sql = 'UPDATE sensor_last
        SET value1="'.$lastval1.'",value2="'.$lastval2.'",value3="'.$lastval3.'",value4="'.$lastval4.'"
        WHERE id=1';
$retval = mysql_query($sql);
if(! $retval ){
  die('Could not update data: ' . mysql_error());
}

----------------------
reader.php - this file we use to get latest data from database as response to ajax request.
----------------------

require_once('db_conf.php');

$sql = "SELECT * FROM `sensor_last` where `id`= 1";
$result = mysql_query($sql);
if(mysql_num_rows($result)>0){
  while ($par1 = mysql_fetch_array($result)){
    echo json_encode(['value1' => $par1['value1'],
                      'value2' => $par1['value2'],
                      'value3' => $par1['value3'],
                      'value4' => $par1['value4']
                     ]);
  }
}

----------------------
This is just mysql for database table creation. As log as we use 4 sensors, we need 4 table cells.---------------------- CREATE TABLE IF NOT EXISTS `sensor_last4` ( `id` int(11) NOT NULL AUTO_INCREMENT, `value1` int(11) NOT NULL, `value2` int(11) NOT NULL, `value3` int(11) NOT NULL, `value4` int(11) NOT NULL ); ALTER TABLE `sensor_last4` ADD PRIMARY KEY (`id`); ----------------------
JavaScript frontend
----------------------

   var ctx;
   var myLineChart;
   var colors = ['#ff4b00', '#bac900', '#EC1813', '#55BCBE', '#D2204C', '#FF0000', '#ada59a', '#3e647e']; // the list of colors, it is used to create charts with different colors

   ctx = document.getElementById("areachart").getContext("2d");
   var chartData = {
       labels: timelabel(),
       datasets: []
   };
   var chartOpt = { // chart options
      scaleShowGridLines : true,
      scaleGridLineColor : "rgba(0,0,0,.05)",
      scaleGridLineWidth : 1,
      scaleShowHorizontalLines: true,
      scaleShowVerticalLines: true,
      bezierCurve : true,
      bezierCurveTension : 0.4,
      pointDot : true,
      pointDotRadius : 5,
      pointDotStrokeWidth : 1,
      pointHitDetectionRadius : 20,
      datasetStroke : true,
      datasetStrokeWidth : 2,
      datasetFill : false,
      legendTemplate : "<ul class=\"<%=name.toLowerCase()%>-legend\"><% for (var i=0; i
<span style=\"background-color:<%=datasets[i].strokeColor%>\"></span><%if(datasets[i].label){%><%=datasets[i].label%><%}%>
<%}%></ul>"
  }

  myLineChart = new Chart(ctx, {  // chart object
   type: 'line',
   data: chartData,
   options: chartOpt
  });

  myLineChart.options.animation=false; //turn-off weird animation to make possible dynamically stream data
  myLineChart.options.scales.yAxes[0].ticks.suggestedMin=50;  //scale range defining
  myLineChart.options.scales.yAxes[0].ticks.suggestedMax=150; //

  function timelabel(){ // function to append timescale
   var times = [];
   var date = new Date;
   var seconds = date.getSeconds();
   var minutes = date.getMinutes();
   var hour = date.getHours();

   for (var i = 0; i < 20; i++) {
     times.push(hour+" : "+minutes+" : "+seconds);
    }
   return times;
   };

  function dataUpd (chart,dataset,newdata){ // function to update datasets
   chart.data.datasets[dataset].data.push(newdata);
   chart.data.datasets[dataset].data.shift();
  }
  function timeUpd (chart){ // function to update timescale
   var date = new Date;
   var seconds = date.getSeconds();
   var minutes = date.getMinutes();
   var hour = date.getHours();
   chart.data.labels.push(hour+" : "+minutes+" : "+seconds);
   chart.data.labels.shift();
  }
  function insertNewDataset(chart,label,color){ // function to insert new data
   var dataset = {
     label: label,
     fill:false,
     borderColor: color,
     pointBorderColor: "rgba(220,220,220,1)",
     pointBackgroundColor: "#fff",
     pointBorderWidth: 1,
     pointHoverRadius: 5,
     pointHoverBackgroundColor: "rgba(220,220,220,1)",
     pointHoverBorderColor: "rgba(220,220,220,1)",
     pointHoverBorderWidth: 2,
     data: [null,null,null,null,null,null,null,null,null,null,null,null,null,null,null,null,null,null,null,null]
   };
   chart.data.datasets.push(dataset);
   chart.update();
  }
    for (var i = 0; i < 4; i++) {   // for 4 sensors we need to insert 4 datasets
      insertNewDataset(myLineChart,"Sensor "+i, colors[i]);
      function waitForMsg(){ //check for new data in database and load it
        $.ajax({
            type: "GET",
            url: "reader.php",
            async: true, /* If set to non-async, browser shows page as "Loading.."*/
            cache: false,
            dataType: "json",
            timeout:10000, /* Timeout in ms */
            success: function(data){

                $(data).each(function(key, data) { //insert data into 4 datasets
                    dataUpd(myLineChart,0,data.value1);
                    dataUpd(myLineChart,1,data.value2);
                    dataUpd(myLineChart,2,data.value3);
                    dataUpd(myLineChart,3,data.value4);
                });
                myLineChart.update();
                timeUpd(myLineChart);
                setTimeout(
                    waitForMsg, /* Request next message */
                    200 /* ..after 200 milliseconds */
                );

            },
            error: function(XMLHttpRequest, textStatus, errorThrown){
                addmsg("error", textStatus + " (" + errorThrown + ")");
                setTimeout(
                    waitForMsg, /* Try again after.. */
                    250); /* milliseconds  */
            }
        });
    };

    $(document).ready(function(){
        waitForMsg(); /* Start the inital request */
    });

----------------------
Total project you can download here
No comments :
Post a Comment